
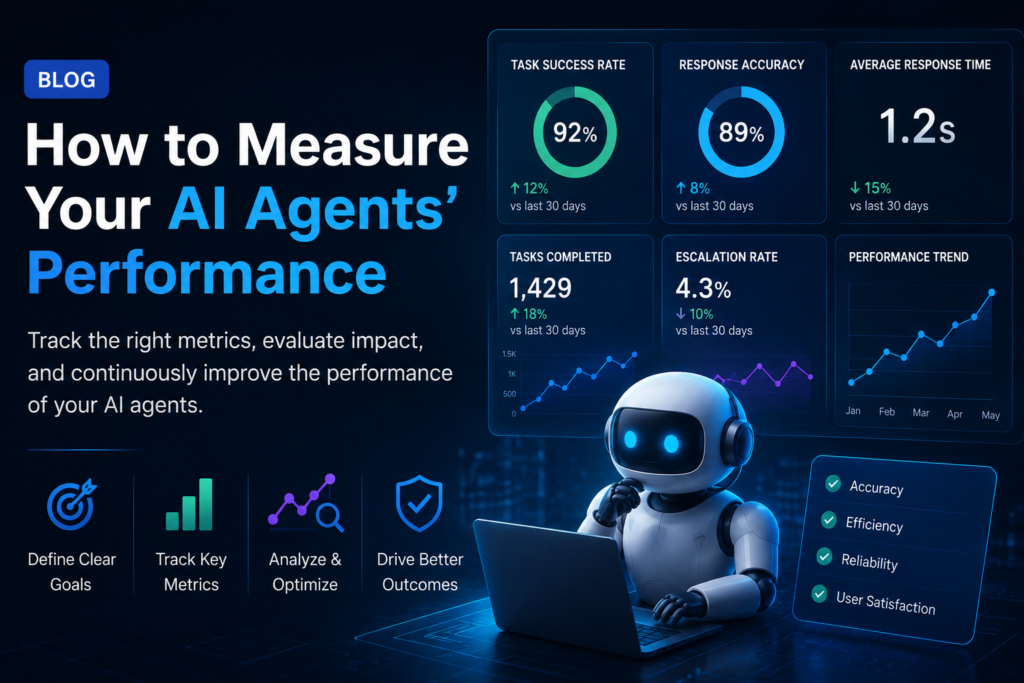
(The Metrics That Actually Matter)
Most teams track the wrong numbers. Here is what separates useful AI agent metrics from expensive vanity dashboards.
You deployed AI agents in your SOC. The vendor told you they would reduce alert fatigue, accelerate investigations, and free your analysts to focus on real threats. Six months in, your CISO asks a reasonable question: is it working?
You pull up the dashboard. The agent processed 48,000 alerts last month. It executed 2,800 playbooks. It auto-enriched 12,000 IOCs. The numbers look big. But your CISO asks a follow-up: how do you know it got them right?
This is where most teams go quiet. They have throughput numbers but no accuracy numbers. They know how fast the agent moves but not whether it moves in the right direction. They are measuring engine RPM when they should be measuring whether the car arrived at the destination.
The Vanity Metrics Trap
Vendor dashboards are designed to make AI agents look productive. They prominently display volume metrics: alerts processed, playbooks triggered, enrichments completed, actions taken. These numbers go up and to the right every month because the agent is doing things. But doing things is not the same as doing the right things.
A triage agent that classifies 95% of alerts as false positives looks efficient until you realize it is also classifying 12% of true positives as false positives. That 12% is the number that matters. That 12% is the breach you missed.
| The most dangerous AI agent metric is one that looks good while hiding systematic errors. High throughput with low accuracy is worse than no automation at all, because it gives you false confidence. |
A Framework That Works: Four Layers of AI Agent Measurement
After working with security teams deploying AI agents across triage, investigation, and response, we have found that meaningful measurement requires four layers. Skip any one and you get a distorted picture.
Layer 1: Verdict Accuracy
This is the foundation. Before anything else, you need to know whether your AI agent is making correct decisions. For a triage agent, this means tracking:
- True Positive Rate (Sensitivity). Of all the actual threats that came through, what percentage did the agent correctly identify as threats? If your TPR is 88%, your agent is missing 12% of real incidents. That is your blind spot.
- False Positive Rate. Of all the benign alerts, what percentage did the agent incorrectly flag as threats? This drives analyst workload. A 5% FPR on 50,000 alerts means 2,500 false alarms your team still has to review.
- Analyst Override Rate. How often do your analysts change the agent’s verdict after reviewing it? This is the most honest accuracy metric you have, because it reflects what humans think of the agent’s judgment in practice, not in a test environment.
If your override rate is above 10%, your agent needs retraining or your confidence thresholds need adjustment. If it is below 3%, either your agent is excellent or your analysts are not actually reviewing its work.
Layer 2: Operational Impact
Accuracy tells you if the agent is right. Operational impact tells you if being right actually changes anything. The metrics here connect agent performance to SOC outcomes:
- Mean Time to Verdict (MTV). How long does the agent take to reach a true-positive or false-positive determination? This should be measured in seconds for triage agents. If your MTV is 45 seconds and your manual triage takes 28 minutes, you have a 37x speedup. That number tells a clear story.
- MTTR Delta. What is your mean time to resolve with agent assistance versus without? Measure this by comparing agent-handled cases against manually handled cases in the same time period. The delta is your ROI proof.
- Analyst Hours Reclaimed. Convert the time savings into hours per week. If your agent saves 142 analyst hours per week across your team, that is 3.5 FTE. Your CFO understands that number better than any accuracy percentage.
- Noise Reduction Ratio. Raw alerts in versus cases requiring human review. If 47,000 alerts come in and 847 require human attention, your noise reduction is 98.2%. This is the number
that justifies the investment.
Layer 3: Trust and Governance
An AI agent that is accurate and fast but operates as a black box will eventually cause a problem that nobody can explain. Trust metrics ensure your team knows what the agent is doing and retains meaningful control:
- Explanation Coverage. What percentage of agent decisions include a structured reasoning chain that an analyst can follow? If your agent says an alert is a false positive but cannot show why, your analyst has to reinvestigate from scratch. The explanation is not a nice to have. It is what makes the verdict actionable.
- Autonomous vs. Supervised Actions. Track the ratio of actions the agent took without human approval versus those it escalated. This should be a conscious, configurable decision, not an accident. If your agent is auto-containing hosts without analyst confirmation, you need to know that.
- Escalation Appropriateness. When the agent escalates to a human, is the escalation justified? If 40% of escalations turn out to be things the agent could have handled, your escalation thresholds are too conservative and you are wasting analyst time. If escalations routinely contain insufficient context, your agent is not doing enough work before handing off.
Layer 4: Drift and Degradation
AI agent performance is not static. The threat landscape changes, your environment changes, and the agent’s effectiveness drifts over time. You need to detect that drift before it becomes a gap:
- Weekly Accuracy Trend. Plot your override rate, TPR, and FPR on a weekly basis. A gradual increase in override rate over 4-6 weeks is the early warning signal that your agent’s models are going stale.
- Category-Level Accuracy. Your agent might be 95% accurate overall but 60% accurate on a specific attack category that just emerged. Break accuracy down by threat type, source, and severity. The aggregate hides the gaps.
- Confidence Score Calibration. If your agent says it is 90% confident, is it actually correct 90% of the time? Plot predicted confidence against actual accuracy. If the calibration curve drifts, your agent is overconfident or underconfident, and your automation thresholds based on confidence scores are no longer valid.
Metrics You Should Stop Tracking
Not every number on your AI dashboard deserves a KPI tile. Some metrics actively mislead by making the agent look better than it is:
- Total alerts processed. This goes up linearly with alert volume, not agent quality. A broken agent that auto-closes everything also processes 100% of alerts.
- Playbook execution count. A playbook that runs 3,000 times a month is not necessarily a good playbook. It might be firing on false triggers or running redundant steps. Execution count without outcome tracking is noise.
- Average response time without accuracy. Speed is meaningless without correctness. An agent that responds in 2 seconds but gets it wrong 20% of the time is creating work, not eliminating it.
Building a Measurement System That Lasts
The practical challenge is not identifying the right metrics. It is building the instrumentation to capture them. Most AI agent platforms do not expose accuracy metrics natively because it requires a feedback loop from analyst actions back to agent decisions.
Here is a realistic implementation sequence:
- Week 1: Instrument the override. Every time an analyst changes an agent verdict, log the original verdict, the new verdict, and the case context. This single data point gives you override rate and directional accuracy immediately.
- Week 2-3: Build the confusion matrix. Use the override data plus confirmed outcomes (closed cases with final disposition) to compute TPR, FPR, precision, and recall. Update weekly.
- Month 1: Add operational impact. Connect agent activity to case timelines. Compute MTV, MTTR delta, and analyst hours reclaimed. Segment by agent type (triage vs. investigation vs. response).
- Month 2: Add drift detection. Plot accuracy metrics as time series. Set alerts for when override rate exceeds your threshold (we recommend 8%) or when category-level accuracy drops below 85%.
- Ongoing: Calibration audits. Monthly review of confidence score calibration. Quarterly review of escalation appropriateness. Annual review of autonomous action boundaries.
The Conversation Your Team Needs to Have
| The real question is not whether your AI agents are performing well. It is whether you have built the measurement infrastructure to know the answer with confidence. Most teams have not. |
If you cannot answer these four questions today, you have a measurement gap:
- What is your triage agent’s true positive rate this week, and how does it compare to four weeks ago?
- How many analyst hours did your agents save last month, and what would those analysts have been doing instead?
- What percentage of your agent’s autonomous actions were reviewed by a human, and what was the disagreement rate?
- Which threat category has the lowest agent accuracy, and when did it start declining?
If you can answer all four, you are ahead of most security teams running AI agents. If you cannot, the metrics in this post give you a concrete starting point.
The agents are only as trustworthy as your ability to verify their work. Build the feedback loop first. The performance will follow.
Frequently Asked Questions
Why are common AI agent metrics like alert volume or playbooks executed misleading?
These ‘vanity metrics’ go up simply because the agent is active, not because it’s making good decisions. A triage agent could classify 95% of alerts as false positives and look extremely efficient, while also misclassifying 12% of actual true positives as false, which is the far more important number.
What is Layer 1 of the measurement framework, and what does it track?
Layer 1 is Verdict Accuracy, the foundation of the framework. It covers True Positive Rate (the share of real threats correctly identified), False Positive Rate (the share of benign alerts incorrectly flagged), and Analyst Override Rate, which reflects how often humans actually disagree with the agent’s verdict in practice.
What does a high or low analyst override rate suggest about an AI agent?
An override rate above roughly 10% suggests the agent needs retraining or its confidence thresholds need adjustment. An override rate below about 3% could mean the agent is performing excellently, but it could also mean analysts aren’t genuinely reviewing its decisions.
What is Layer 2, Operational Impact, meant to measure?
Operational Impact connects accuracy to real SOC outcomes, using metrics like Mean Time to Verdict, the MTTR delta between agent-assisted and manually handled cases, analyst hours reclaimed (converted into FTE terms), and the noise reduction ratio between raw alerts and cases that actually need human review.
What do Layer 3 (Trust and Governance) metrics cover?
This layer tracks Explanation Coverage, the percentage of decisions accompanied by reasoning an analyst can follow, the ratio of autonomous versus supervised actions the agent takes, and whether escalations to humans are actually justified rather than either overly cautious or under-contextualized.
Why is drift detection (Layer 4) necessary even for an agent that started out accurate?
AI agent performance isn’t static; the threat landscape and environment change over time, causing effectiveness to drift. Layer 4 tracks weekly accuracy trends, category-level accuracy breakdowns (since aggregate numbers can hide gaps in specific attack types), and whether the agent’s stated confidence scores are actually well calibrated to real outcomes.
What’s a realistic first step for building this kind of measurement system?
The blog recommends starting by instrumenting every analyst override, logging the original verdict, the corrected verdict, and the case context. That single data point alone gives you an immediate override rate and a directional read on accuracy before building out the full confusion matrix and operational-impact metrics.